
(Click on graph for bigger and better image.)

(Click on graph for bigger and better image.)
The page reports the accuracy of the predicted high temperatures for Fallbrook, in north San Diego County, for summer 1997. The official reporting weather station is located approximately 14 miles from the coast. The predictions cover a period of 44 days from 17 July 1997 thru 29 August 1997, and come from:
This period spanned the full range of expected temperatures in the summer, including one spell of extended heat above 100o, as well as a period of cool temperatures when the marine layer spent some extended time over Fallbrook. See the plot on the left below for the actual and predicted temperatures during this period. For the lagged predictions, mentally shift the blue curve over 1 day.
The plot on the right shows the error in prediction from the 3 sources.
(Click on graph for bigger and better image.) | (Click on graph for bigger and better image.) |
The plot on the right above reveals a high correlation between all predictions, which can also be seen on the plot on the left after lagging the observed temperatures 1 day. The only times of significant discrepancies are:
The formal statistics on the prediction accuracies are in the following table:
| Prediction Source | |||||
|---|---|---|---|---|---|
| Measure | Accuweather | Weatherdata | Lagged temps | Ave. of accuweather and lagged temps | Ave. of weatherdata and lagged temps |
| Mean | 2.0 | 1.2 | 0.0 | 1.0 | 0.7 |
| Median | 2.0 | 1.0 | 0.0 | 1.5 | 0.5 |
| Scatter about mean (1 sigma) | 4.6 | 4.4 | 4.8 | 4.3 | 3.8 |
| Scatter about 0 (1 sigma) | 5.0 | 4.6 | 4.8 | 4.4 | 3.8 |
I included all points, without tossing any outliers, since the error plot above doesn't show any obvious typos in the temperatures.
I draw the following conclusions from the data above:
The following plot summarizes the distribution of prediction errors. It gives the fraction of predicted temperatures that were within a given temperature range. The legend gives the methods from best to worst.
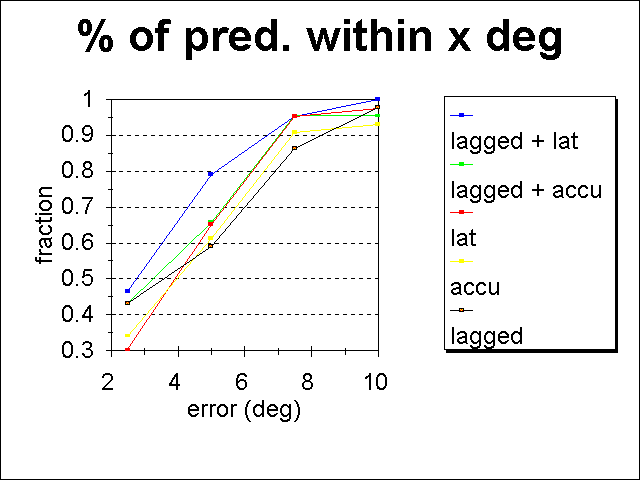
The plot shows that half of all predictions are within less than 3o for the best predictor - the average of the Weatherdata (the L.A. Times forecast) and the high temperature the day before. All the other prediction methods have half of their predictions within 3-4o.
Hence my main conclusion: in the summer, the most accurate forecast temperature for Fallbrook is to take the L.A. Times predicted high and average that with yesterday's high.
The motivation for this analysis was two-fold. First, Scott Chester analyzed the accuracy of predicted temperatures for winter for a science fair project. Second, I gathered these temperatures to investigate how much hotter Fallbrook temperatures were compared to Vista temperatures, in response to a statement made by a real-estate agent touting the superiority of Vista's climate.
Go To:
Copyright © 1997 by Tom Chester.
Permission is freely granted to reproduce any or all of this page as long as credit is given to me at this source:
http://sd.znet.com/~schester/fallbrook/weather/analysis/accuracy_of_predicted_high_temperatures.html
Comments and feedback: Tom Chester
Last update: 30 August 1997 (url changed 31 December 1997).