Severe Loss of Lemon Lilies in Candy's Creek from 2010 to 2021 and Partial Recovery in 2022 to 2025
David Stith, Tom Chester, and Deb Nelson
|
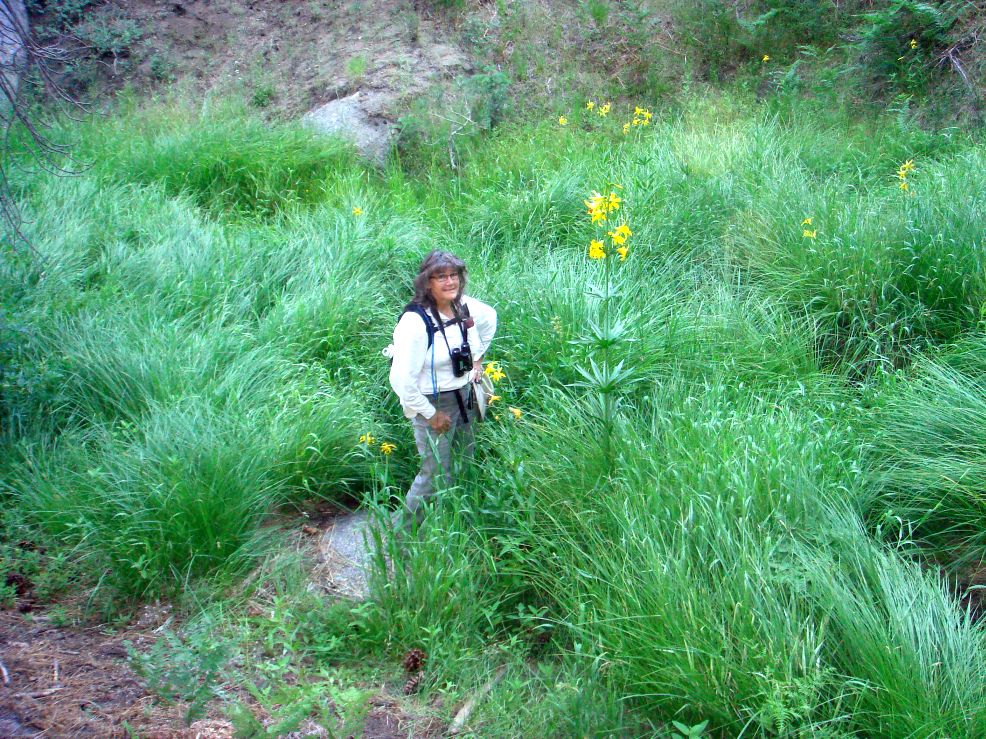
| Fig. 1. Twelve Lemon Lilies in bloom on 26 July 2011 in the meadowy area along Candy's Creek just below where the Caramba Trail crosses the Creek. The tall lily next to Pam Pallette is the Grandfather Lemon Lily. In 2022, all of those lemon lilies were no longer present, and no new lemon lilies had appeared.
Click on the picture for a larger version showing a larger area. |
Table of Contents
Abstract
Introduction
Survey Results
Conclusions
Appendix: Survey Participants
Abstract
We censused the number of lemon lilies with tall stems in Candy's Creek ten times from 2010 to 2025. From 2010 to 2022, there was a severe decline of 68% in the number of tall stems from the average of the years 2010 to 2016 to the average of the years of 2020 to 2022. The loss of plants was seen throughout the length of the creek, with the highest losses in the uppermost part of the creek.
The decline in numbers was likely primarily due to erosion and deposition from a very unusual warm heavy rain in April 2020, combined with low total rainfall in 2020 and 2021. Erosion was observed in the uppermost part of the creek that removed the stream bank where three lemon lilies had been present. Sediment deposition, combined with low rainfall, likely allowed increased predation by gophers, removing plants farther down the creek. We also observed a complete loss of lemon lilies in a small meadowy area just below the area we censused, probably caused by those same factors.
Analysis of the number of flowers per stem in blooming plants shows that the population went from being a healthy equilibrium population in 2010 and 2011 to being a non-equilibrium population that was lacking in young plants, beginning in 2020.
The 2023 and 2024 census showed significant population recovery. The number of tall stems in Candy's Creek tripled in 2023 compared to 2020 and 2021, with the population now beginning to approach the numbers seen in 2013 and 2016.
2025 was a low rainfall year, with only half the usual rainfall, and the numbers declined slightly.
Introduction
In 2009, the first two authors, Dave and Tom, devoted 15 days to do a lemon lily census in Willow and Tahquitz Creeks, which gave a snapshot of the Lilium parryi population in those areas at that time. Our surveys in 2009 found a healthy population of lemon lilies in those creeks, a total of 2,662 individual plants, with about half the plants with bloom stalks, and half the plants younger individuals, often very young plants with a single leaf.
It is of course impossible from a single survey to determine if the population is increasing, stable or declining, and there is no historical data with which to compare our numbers. Nor does a single survey reveal anything about yearly fluctuations in the population if they do occur, and what factors may influence those changes. Only repeated surveys over a period of many years can answer those questions. Due to the labor-intensive nature of our initial survey it seemed unlikely that we or anyone else would be able to repeat it in a routine manner. Hence in order to document how the population changes with time, Dave decided to begin repeated surveys of Candy's Creek, since that survey can be done in a single day.
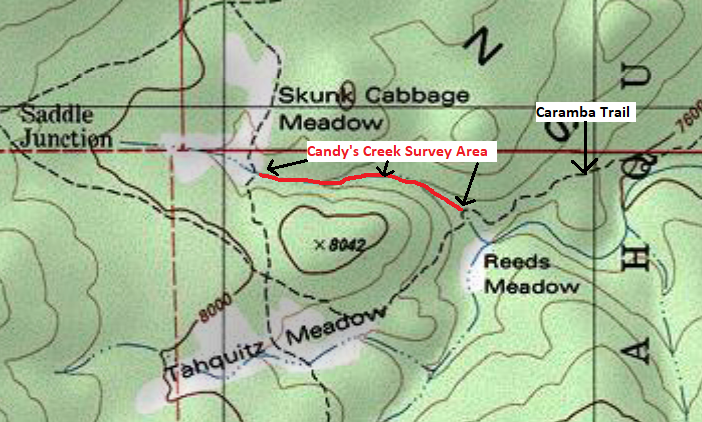
Candy's Creek is the 0.43 mile drainage from the bottom of Skunk Cabbage Meadow, that joins Tahquitz Creek below Reeds Meadow. Its elevation ranges from 7900 feet at the bottom of Skunk Cabbage Meadow, to 7690 feet at its junction with Tahquitz Creek.
"Candy's Creek" is an informal name given to it by one of the rangers, supposedly naming it for the wife of one of the rangers. There was an official-looking sign (see Nick Shah's picture of it from August 2011) posted where the Caramba Trail crosses Candy's Creek for a number of years.
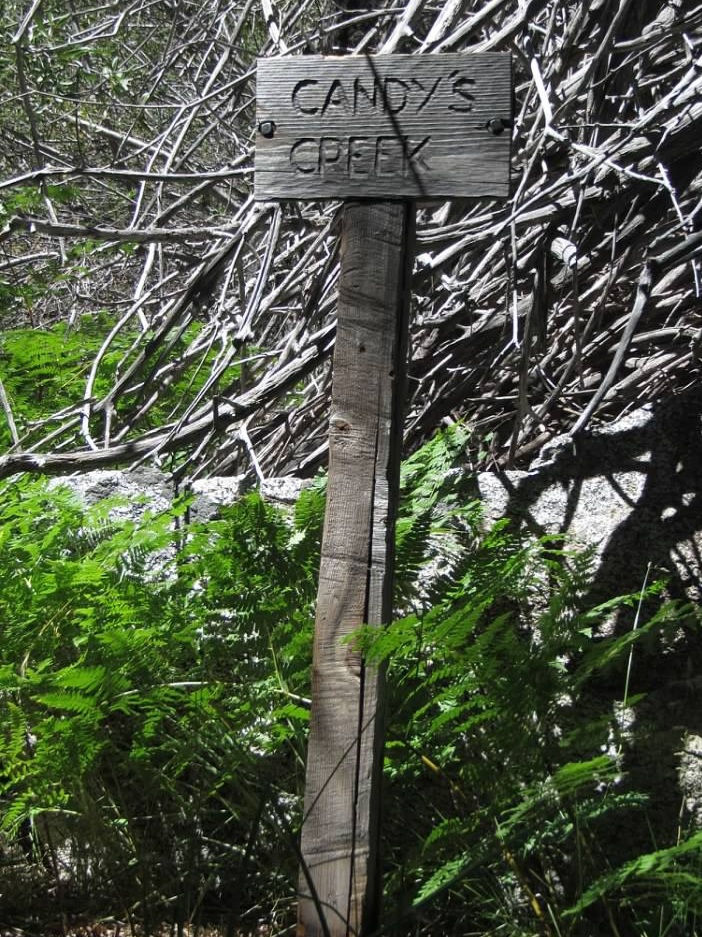
Dave and Tom surveyed the entire creek on 21 October 2009, finding only 74 plants total that year, including babies. This was undoubtedly a severe undercount due to how late in the year the survey was conducted. On that survey, as on all our surveys, we only counted plants that we were 100% sure were lemon lilies. This meant old lemon lily stalks without fruit, that could be confused with old stalks of lupines, were not counted, and dried up lemon lily leaves from young plants with a single leaf could not be counted.
The first good count of the entire creek was made on 18 and 23 July 2010 by Dave, finding a total of 387 plants, including babies. This represents 13% of the total number of lemon lilies in the sum of this creek and Willow and Tahquitz Creeks.
However, surveys that count all plants, including baby plants with single leaves, are very time-consuming, and require "beating the bushes" to find all the baby plants hiding under the sedges, grasses, and bracken ferns. We had also been doing surveys counting the number of fruit per stem, and quickly realized that just counting the number of plants that had bloom stalks was an excellent proxy for the number of plants in most years. In our extensive surveys of Willow and Tahquitz plants, the number of non-blooming plants was consistently about equal to the number of blooming plants. Also, the health of a population depends only on maintaining the number of plants that produce seeds.
Hence on 24 September 2010, we returned to Candy's Creek to count the number of stems with fruit. We also counted stems eaten by deer that looked like they would have produced fruit if they hadn't been munched, as well as one stem that seemed large enough to produce flowers, but didn't have any fruit. We counted 243 such plants, representing 63% of the total number of plants Dave counted earlier that year. This was a somewhat-higher percentage than we had typically seen, but it is certainly possible that there were more baby plants that weren't counted in the earlier survey, since in many places the vegetation is quite dense, denser than in most places in our survey of Willow and Tahquitz Creek, so small plants can not always be seen.
We eventually decided to survey only the 0.40 mile portion of Candy's Creek from just below Skunk Cabbage Meadow to the Caramba Trail crossing (see that portion marked on the topo map). That reduced the number of counted stems on 24 September 2010 from 243 to 225.
In each survey, we noted the total number of flowers produced on each flowering stem, as well as the number of plants eaten by deer and, sometimes, the number of tall stems that did not flower. The number of flowers on each flowering stem was the total number of buds plus flowers plus pedicels with fruit or finished flowers. We counted plants as being eaten by deer if the flower stem was completely missing above the chomped portion. We sometimes counted a "tall stem" if it seemed robust enough to produce a flower, but for some reason didn't. In practice, there is no ambiguity about counting such "tall stems" since they have to be taller than the surrounding plants, typically bracken and manna grass. However, we did not count "tall stems" without flowers on every survey.
Numbers for each of those three categories are reported separately, so one can choose what categories to include for analysis.
The authors, plus a number of collaborators, have now done this survey a total of ten times, from 24 September 2010 to 14 July 2024. This webpage present the results of our surveys. We also present results from an area just below the Caramba Trail, shown in Fig. 1, that we have monitored as well. We did not include that area in our Candy's Creek surveys because it is a meadowy area more similar to the nearby Reeds Meadow.
Survey Results
Population Counts
Table 1 presents the overall counts from our surveys done with the same protocol.
Table 1. Number of Flowering Stems, Eaten Stems, and Tall Non-Blooming Stems.
| Date | # of stems with countable flowers | # of eaten stems | # tall stems with no flowers | TOTAL # tall stems | Growing year Precipitation (inches) |
|---|---|---|---|---|---|
| 09/24/10 | 196 | 28 | 1 | 225 | 30 |
| 07/26/11 | 170 | 25 | 26 | 221 | 40 |
| 07/16/12* | 38 | 35 | 81 | 154 | 25 |
| 07/11/13 | 127 | 54 | 181 | 24 | |
| 07/10/16 | 178 | 6 | 184 | 29 | |
| 08/06/20 | 59 | 59 | 20 | ||
| 07/14/21 | 49 | 1 | 2 | 52 | 13 |
| 07/20/22 | 83 | 2 | 85 | 22 | |
| 07/26/23 | 121 | 1 | 24 | 146 | 50 |
| 07/14/24 | 108 | 0 | 17 | 125 | TBS |
| 07/16/25 | 91 | 13 | 4 | 108 | TBS |
| * A late frost in 2012 aborted buds on many plants. | |||||
The "# of stems with countable flowers" is the number of intact stems that produced flowers.
The "# of eaten stems" are robust stems whose top was entirely bitten off.
The "# of tall stems with no flowers" are stems that seemed robust enough to produce a flower, but for some reason didn't. We unfortunately have been inconsistent as to whether such stems were counted in each survey.
The "TOTAL # tall stems" is the sum of the previous three categories.
Neither the "# of stems with countable flowers", nor the "TOTAL # tall stems", is a perfect measure of the number of mature plants capable of producing a flowering stalk, for the following reasons:
- In 2010 through 2013, 10 to 30% of the tall stems were munched by deer, and hence the true "# of stems with countable flowers", if there were no deer predation, is underestimated by at least that amount. The late frost in 2012 caused many buds to blast, and probably prevented some stems from even producing buds.
- Because we were inconsistent in whether we counted the "# of tall stems with no flowers", caution must be used in comparing the numbers from different years.
Fortunately, with the exception of the very anomalous year of 2012, the trend is the same for both the "# of stems with countable flowers" and the "TOTAL # tall stems". The precise numbers in each category must be taken with caveats.
Precipitation data is from July of the previous year to June of the year of the survey, which covers the growing season for the July flowers of each year. For example, the total for the 9/24/10 survey is from July 2009 to June 2010, which is the precipitation that produced the flowers in July 2010 and the fruit we counted in September 2010. Nearly all of that precipitation falls in December through March. The data are from the PRISM Climate Group for their cell containing Candy's Creek at 33.7757° N. Latitude and -116.6671° E. Longitude, which they place at an elevation of 8700 feet, which is somewhat higher than the 7700 to 7900 feet range of Candy's Creek. Their precipitation estimates use modeling coupled with the (few) nearby weather stations, and of course have a fairly large uncertainty. However, since precipitation is highly correlated throughout the coastal and mountain areas in southern California, the relative values from year to year should be meaningful.
With the exception of the 2016 survey, we were not able to do surveys in the five years that the Forest was closed after the 2013 Mountain Fire. The 2016 survey was done by Deb Nelson, the Forest Service botanist, and collaborators, after Deb was able to get permission for that survey.
The dramatic drop in the number of stems with countable flowers in 2012 was due to a late frost. We observed 81 stems that were tall enough, and robust enough, to produce flowers, but did not do so. This number of tall stems that didn't produce flowers was much larger than in any other year. At least half of those stems had aborted buds, a clear sign of being hit by frost at a time when the plants did not expect it. We have not seen more than one or two stems with aborted buds in any other year; we suspect insect damage was responsible for those aborted buds, but do not know the cause for sure. We also observed that thimbleberries, Rubus parviflorus, on the Devils Slide Trail that year looked like they had been hit by a late frost as well.
The number of eaten stems dropped dramatically after the Mountain Fire in late July 2013. The eaten stems are due to deer. The most likely cause for the dramatic drop is that the deer preferred to eat the new growth in the extensive burn area in Tahquitz Valley. Dave and Tom used to see deer quite commonly in Skunk Cabbage Meadow and Tahquitz Meadow before the fire. After the fire, Tom has seen no deer at all in the meadows, but observed many deer in the burn areas. Deer are still munching lily stems farther west. Bruce Watts observed four munched stems, out of 19 total tall stems, in Stone Creek in 2023.
The most striking feature of the precipitation for our survey years is that the lowest rainfall values occurred in the years 2020, 2021, and 2022. This marked decline in precipitation, coupled with the hotter climate in those years, has likely caused a long-term decline in the lemon lily population, in both the recruitment of new lily plants, and in allowing gophers to access lilies that were previously protected by ground moisture.
However, it does not appear that variation in the yearly precipitation has a direct effect on the number of tall stems in that year, since there is not a good correlation between yearly precipitation and the total number of tall stems in that year. For example, 2022 had 22 inches of precipitation and 85 total tall stems, whereas 2013 had close to same precipitation, 24 inches, but had more than twice as many tall stems. This lack of yearly correlation is probably because Candy's Creek has water in it during the lemon lily growing season that the lilies access even in years with low precipitation, and because it takes three to five years for the population to respond to a different rainfall regime (this is the time it takes for a seedling to grow to flowering).
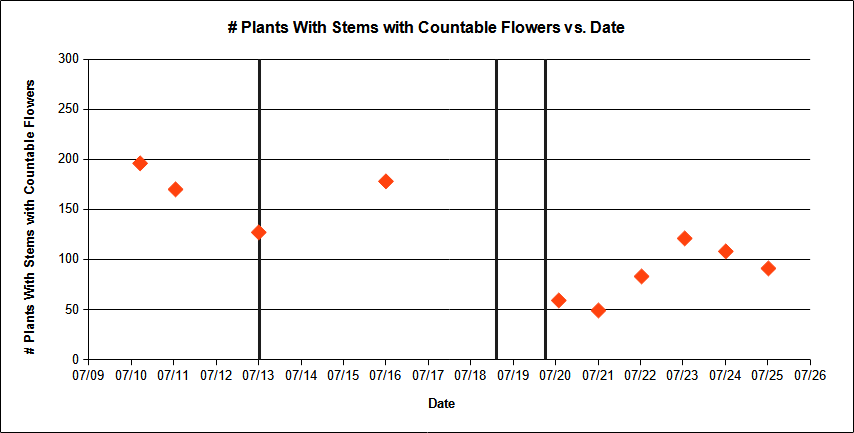
The number of tall stems is shown vs. date in Fig. 2, excluding the anomalous late-frost 2012 count.
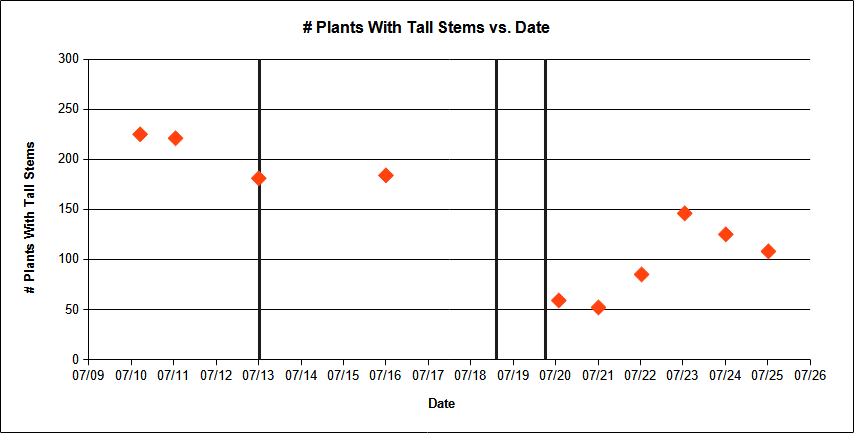
Fig. 2. Number of Tall Stems vs. Date. The number of tall stems includes plants with flowering stems; plants munched by deer; and robust stems with no flowers. The counts from 2012 were not included because a late frost affected the growth of the plants that year. The three vertical black lines indicate strong erosional rain events at San Jacinto Mountain (not necessarily at Candy's Creek) on 21 July 2013, 14 February 2019, and 10 April 2020.
The plot using just the counts of flowering stems looks similar overall.
The six lowest counts are from the surveys in the last six years, although the 2023 count approached the numbers seen in the first survey years. The average for 2020, 2021 and 2022 is 65 plants with tall stems, compared to an average of 203 plants in 2010, 2011, 2013, and 2016. The average for 2020, 2021 and 2022 is only 32% of the earlier average, a loss of two-thirds of the plants.
The recent low counts are almost surely mostly due to erosional / depositional rain events in 2019 and 2020 (see below), although there may also be a long-term decline as well.
The 2013 event was a combination of monsoonal moisture plus the pyrocumulus cloud from the Mountain Fire, which occurred just after the 2013 survey. Although that event caused unprecedented deposition of eroded material in Tahquitz Valley near Laws Camp, and in Round Valley, it did not seem to have had any effect on the lemon lilies in Candy's Creek.
The warm intense rainfall of February 14, 2019 wiped out major portions of SR243 and SR74, resulting in the need for major reconstruction for both of those highways. There was yet another very-unusual heavy warm rainfall event in April 2020 that scoured a number of streambeds in Garner Valley. Either, or both, of those events was likely the major factor that knocked down the lemon lily population in Candy's Creek.
We did not try to fit any straight line, or other curve, to the data shown in Fig. 2, since we have additional evidence, presented below, that most of the change was due to the 2019 and/or 2020 unusual erosional events.
Beginning in 2019 we recorded the GPS locations of each population of lemon lilies in Candy's Creek, with each survey having 18 to 22 locations in the 0.40 miles of the surveyed creek, an average spacing of 0.02 miles (100 feet = 30 m). That enabled us to see how the distribution of tall plants has changed over time, by plotting the cumulative number of tall plants seen in each survey vs. distance along the creek. We use the cumulative number of plants because individual GPS points have a scatter of about 0.02 miles in the Candy's Creek area, due to heavy vegetation, and the location in a valley with nearby rocky hillsides. That makes it difficult to match up individual counts, but has little effect on cumulative counts.
Fig. 3 shows the detailed cumulative number of "tall stems" from east to west in Candy's Creek, from the 2019 and subsequent surveys through 2023, and just the total number found in the surveys before that.
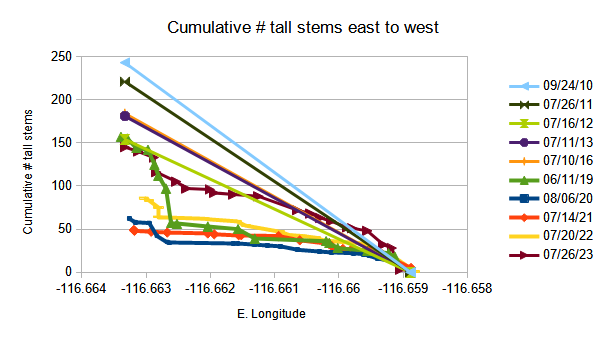
Fig. 3. Cumulative number of "tall stems" from east to west in Candy's Creek (from right to left in the plot) from the 2019 and subsequent surveys. The previous surveys did not keep track of the locations of the plants, so they are represented only by a straight line showing the total number of "tall stems" found.
The 2019 survey was done differently from the usual surveys, and hence did not appear in Table 1. It was an early survey on 11 June before the plants bloomed, while the stems were still growing, but we still kept track of which plants were short (plants unlikely to bloom later that year) or tall (plants likely to bloom later that year). Although that makes it difficult to directly compare the number of plants to the other survey, the 2019 survey revealed that over half the population of the tall stems was in the westernmost 20% of Candy's Creek! That is consistent with our memories of some of the earlier surveys, in which we saw large number of blooming lemon lilies in that western section. However, in the very first survey, in 2010, we did separately keep track of the number of lilies in the upper creek, and the lower creek, and found most of the lilies in the lower creek.
The number of tall stems in that area dropped precipitously in 2020, stayed roughly the same in 2021, made a small recovery in 2022, and a bigger recovery in 2023.
We also observed, from repeat photography, that three lemon lilies in this westernmost (upper) area of Candy's Creek were lost sometime between 2011 and 2020 when erosion took away the stream bank in which they lived. That observed erosion is consistent with happening in April 2020, but of course could have happened anytime between 2011 and 2020.
We have lemon lily population data from one other location in Candy's Creek, a small meadowy area that is just below the lowest point of our repeat-census area shown in Fig. 1. We did not include that area in our Candy's Creek surveys because it is a meadowy area more similar to the nearby Reeds Meadow.
That area contained 12 blooming lemon lilies on 26 July 2011. It contained only four blooming lemon lilies in 2021, zero blooming lemon lilies in 2020; two in 2021; and zero in 2022 and 2023.
It is not clear what caused the disappearance of those 12 lemon lilies. The first time we were able to check that area was in 2020, after the 2013 Mountain Fire, and there was no physical evidence of changes in that area. The biggest lemon lily in that area, the Grandfather Lemon Lily, underwent bulb-splitting beginning in 2013, which often results in the death of the lily. But it is very unlikely that bulb-splitting happened to the 11 other lilies there.
It is possible that there was sediment dropped in this flattish area by Candy's Creek that allowed gophers to access some or all of these lilies, with the sediment removed later by other rain events. It is also possible that the hydrology of the Creek changed in this area, leaving some of the lemon lily locations too dry to support lilies.
Bloom Count Analysis
Analysis of the number of total flowers per stem confirms that the population of lemon lilies changed between the period 2010 through 2016 and the period 2020 to 2023. Fig. 4 shows the histogram of the number of total flowers produced on each stem for each survey.
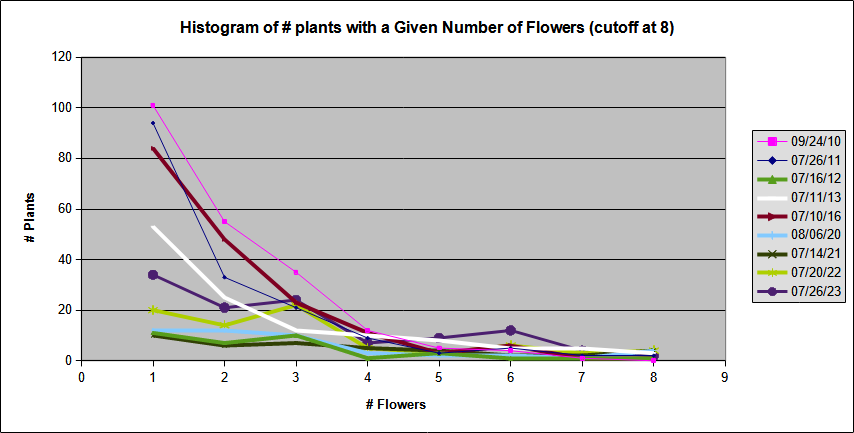
Fig. 4. Histogram of the number of total flowers produced on each stem for each survey.
The curves have a very different shape in 2012, 2020, 2021, and 2022, indicating that something happened to the population in those years that was not just a loss of two-thirds of the plants of all age classes. For 2012, the cause was a late frost.
Fig. 5 gives the summed normalized histogram for the "good years" of 2010, 2011, 2013, and 2016; the "bad years" of 2020, 2021, and 2022; and the recent survey year of 2023.
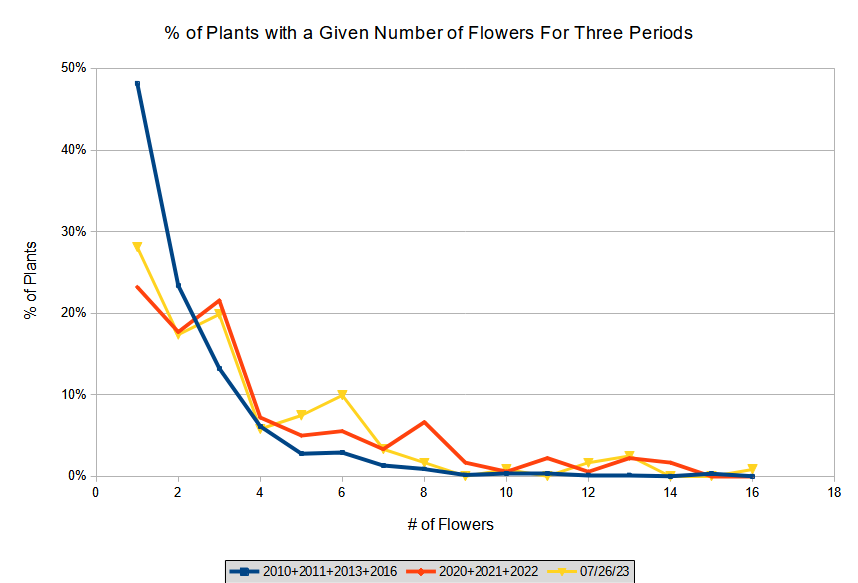
Fig. 5. Normalized histogram of the number of total flowers produced on each stem for the "good years" of 2010, 2011, 2013, and 2016; for the bad years of 2020, 2021, and 2022; and the most recent survey year of 2023. The histograms are normalized as a percentage of the total number of stems.
The histogram in Fig. 5 for the "good years" matches what we found in our 2009 surveys of Willow and Tahquitz Creek. About half the number of blooming plants have a single flower, with declining numbers of plants with more flowers. This represents a healthy population, with plants gradually increasing the number of flowers per stem each year until they die, with the number of plants with a single flower augmented each year by younger plants producing their first flowers.
The histogram for 2020, 2021, and 2022, as well as 2023, shown in Fig. 5 are both missing about half of the expected number of younger plants producing their first flowers, indicating that the population is not in equilibrium. However, the large number of non-blooming tall stems observed in 2023 hints that the histogram in 2024 may prove to be much closer to that of the "good years", if some of those plants begin blooming with one flower then.
Fig. 6 gives the median number of flowers per stem versus time, which has its highest values in the five years of 2020, 2021, 2022, 2023, and 2024. This is another way to see that the population as a whole is aged, lacking the number of younger members it used to have. The median number dropped back to two in 2025.
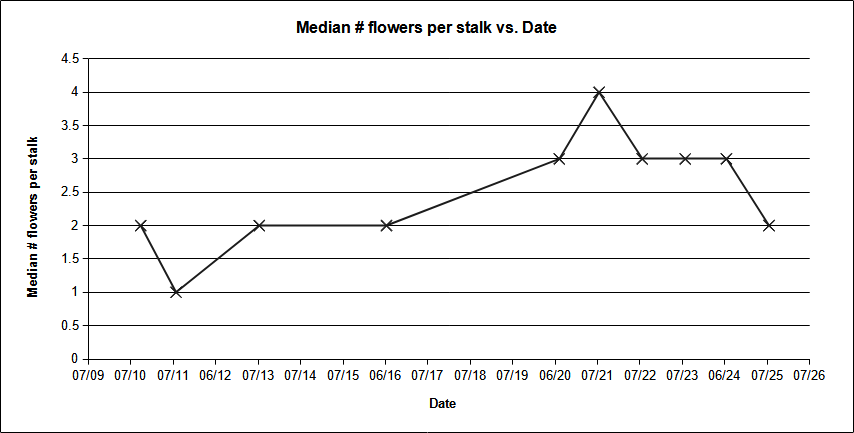
Fig. 6. Median number of flowers per stem versus time.
Fig. 7 gives the maximum number of flowers per stem observed in each of the surveys.
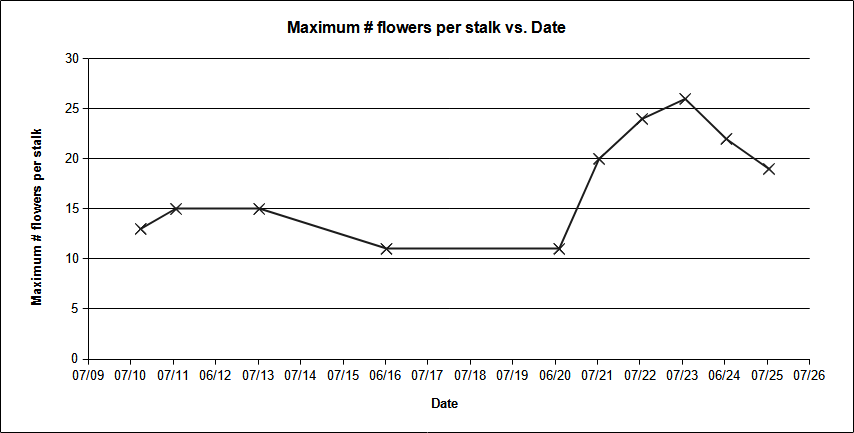
Fig. 7. Maximum number of flowers per stem versus time.
It is interesting that in the years of 2021 through 2025 we observed flower stalks with 19 to 26 flowers per stem, which was more than in any of the previous years. We have no idea why there weren't individual stalks with 19 to 26 flowers in the years of 2010 through 2020, when the population as a whole was healthier.
Presumably, an individual plant keeps increasing its number of flowers with time, unless conditions change at the location of the plant, or the bulb splits, producing two stems with significantly fewer flowers per stem in some cases, or dies, in other cases. When that happens, the maximum number of flowers per stem might come from another plant in the survey. So it isn't surprising to see the maximum number of flowers per stem increase for a few years, as in 2021 to 2023, and then decrease, as in 2023 to 2025, when the lily producing that maximum number of flowers has changed circumstances.
Additional Observations
We observed one additional change in the Candy's Creek population in 2020, which also occurred in four other lemon lily locations at San Jacinto Mountain. Normally, in every year, in every lemon lily population we have observed, fruit set is an amazing 100%. The only flowers that sometimes don't get pollinated are the first or last flowers in an entire population, since there is no other flower to pollinate those. But in 2020, only about half of the flowers set fruit.
There was an interesting pattern in the data from all five locations combined. Plants with just one or two flowers set just 14% of them with fruit; plants with three flowers set 44% with fruit; plants with four to eight flowers set 57% with fruit; and plants with ten to 13 flowers set 68% with fruit. For lilies with multiple flowers, it was still true that the first and last flowers were more likely to be unpollinated. But this wasn't strictly the case; some middle flowers did not set fruit. Our best speculation is that this low fruit set was due to fewer blooms that year, along with fewer pollinator visits. Perhaps the pollinators were spending most of the time in the burn area that year.
Fortunately, fruit set returned to the usual near-100% in 2021.
Conclusions
The results from this 14 year period are dramatic. The number of lilies with bloom stalks, and the total number with tall stalks, declined by nearly two-thirds, with the lowest counts occurring in 2020, 2021, and 2022. The blooming population went from an equilibrium population in 2010 and 2011 to being a non-equilibrium population beginning in 2020 that was lacking in young plants.
The decline in numbers was likely primarily due to erosion and deposition from a very unusual warm heavy rain in April 2020, combined with low total rainfall in 2020 and 2021. Erosion was observed in the uppermost part of the creek that removed the stream bank where three lemon lilies had been present. Sediment deposition, combined with low rainfall, likely allowed increased predation by gophers, removing plants farther down the creek. We also observed a complete loss of lemon lilies in a small meadowy area just below the area we censused, probably caused by those same factors.
Candy's Creek was completely dry in the 2021 survey, the first time in memory it has been completely dry in July, and it was mostly dry again in the 2022 survey.
Fortunately, Candy's Creek was at the highest level we've ever seen in 2023, and the population appears to be recovering after the 2020 erosional event.
The loss of plants with bloom stalks has preferentially occurred in the uppermost part of Candy's Creek, directly below Skunk Cabbage Meadow, and it appears that heavy erosion from an April 2020 storm was to blame.
In addition, lemon lilies have totally disappeared from the meadowy area surrounding Candy's Creek just below the Caramba Trail, dropping from 12 lemon lily plants to zero.
The 2023 census showed significant population recovery. The number of tall stems in Candy's Creek tripled in 2023 compared to 2020 and 2021, with the population now beginning to approach the numbers seen in 2013 and 2016.
These observations may or may not be indicative of the San Jacinto Mountain population as a whole, since the 2013 Mountain Fire decimated some populations, but not the Candy's Creek population. It would be highly informative if similar spot surveys were conducted not only in other regions of the San Jacintos but across the lemon lily's range as well.
Appendix: Survey Participants
The people who participated in each survey are given in Table 2.
Table 2. Participants in each survey in Alphabetical Order.
| Date | Participants |
|---|---|
| 07/18/10 07/23/10 | Dave Stith |
| 09/24/10 | Tom Chester, Dave Stith |
| 07/26/11 | Tom Chester, Pam Pallette, Dave Stith |
| 07/16/12 | Tom Chester, Dave Stith |
| 07/11/13 | Dave Stith |
| 07/10/16 | Jon Anderson, Malka Ducker, Deb Nelson, Dennis Rahn, Laura Verdugo, Bruce Watts |
| 06/11/19 | Nancy Accola, Tom Chester, Don Rideout |
| 08/06/20 | Tom Chester |
| 07/14/21 | Nancy Accola, Deborah Burroughs, Tom Chester, Don Rideout |
| 07/20/22 | Tom Chester, Deb Nelson |
| 07/26/23 | Tom Chester, Patrick Drew, Miranda Kennedy |
| 07/14/24 | Tom Chester, Patrick Drew, Heather Molla, Don Rideout |
| 07/16/25 | Tom Chester, Patrick Drew, Mark Reese |