Plant Species of San Gabriel Mountains: Geographic Distribution Maps for Species Found at Table Mountain
After finding that the Table Mountain Area of the San Gabriel Mountains contains a number of species that I had not seen elsewhere in the San Gabriel Mountains (SnGb), I began a project to look at the geographic distribution in the rest of the San Gabriel Mountains for the species found at Table Mountain. I wanted to find out how many of the species at Table Mountain were found only in, for example, the extreme northern part of the San Gabriel Mountains.
Note that since Table Mountain is in the extreme northeast corner of the San Gabriel Mountains, this biases the geographic distribution maps presented below to always include the Table Mountain area.
This page is an ongoing project began on 16 September 2015, and is incomplete. Only some of the species have been studied so far, and Fig. 2 contains "missing maps" that are just place-holders for maps to be added in the future.
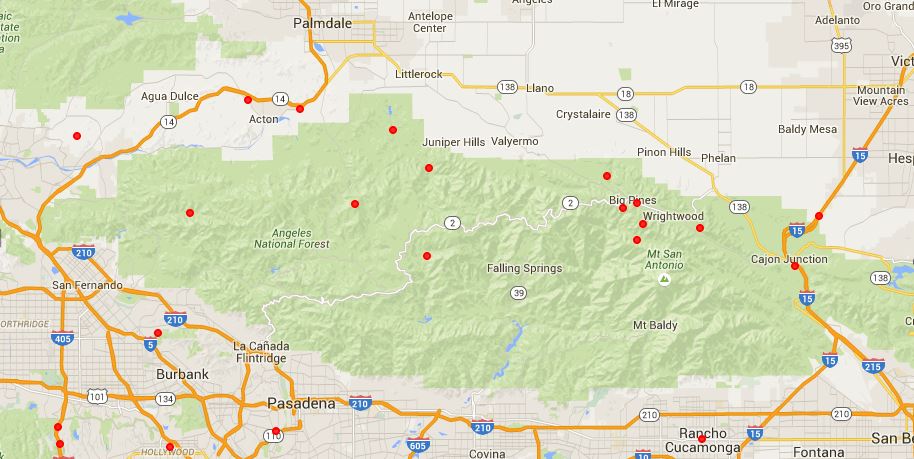
Geographic distribution maps from vouchers for each species are given in Fig. 2. Each map is accompanied by the number of georeferenced vouchers from SnGb, and a computation of the minimum and maximum area occupied by georeferenced vouchers at SnGb.
The maps in Fig. 2 are separated into columns of similar maps, as described in the column header. Within each column, the species maps are arranged in some order, which may be different in different columns. The North Side Species and Northeast Side Species maps are arranged with species with the northernmost distribution at top. The Higher Elevation Surrounding San Gabriel River drainage maps are arranged by the area for each species, from smallest to largest.
The number of vouchers includes only georeferenced vouchers, and is only a rough count of the ones inside the boundaries of the San Gabriel Mountains. This count is not very precise for species that are also found beyond the boundaries of the San Gabriel Mountains, since I used the Consortium clustering herbarium to get the count, which in some cases includes species in neighboring portions.
The area for each species is calculated in two different ways.
First, the maximum area for each species is calculated by using a polygon that encloses all georeferenced voucher locations within the San Gabriel Mountains.
Second, the minimum area for each species is calculated using one or more polygons that enclose closely-spaced georeferenced vouchers. So, for example, if there were a disjunct voucher with a single location, that would not be used in my computation of the area of each species, since the area occupied by the species at that single location would be very small, at least as far as vouchers are concerned.
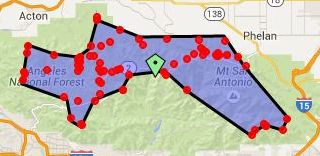
The difference in these two areas is shown in Fig. 1. In both cases, I have sometimes ignored georeferenced locations that I suspect are incorrect, and sometimes enlarged the voucher range when I know the species is found in a larger area around the voucher locations.
| 
|
Fig. 1. Left: the maximum area computation using a single polygon that generously encloses all the georeferenced voucher locations for Leptosiphon breviculus, calculated as 320 square miles.
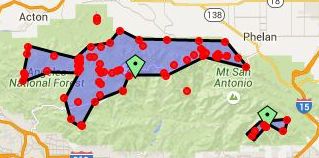
Right: the minimum area computation using (in this case) two polygons that enclose groups of points that are closely-spaced. Note that single points or very-closely-spaced points not near other voucher locations are ignored as contributing very little area. I've also minimized the area by using a more conservative polygon connecting the points at lower left in the map. The sum of the two calculated areas is 185 square miles.
The area was computed using the Consortium / Berkeley Mapper polygon tool using the voucher map, and is also not precise. As a result, numbers have been rounded to the nearest five square miles. For comparison, the area of the entire San Gabriel Mountains, not including the Liebre Mountains north of SR14, is roughly 900 square miles.
There are a number of other ways the computed area can be inaccurate. Vouchers are only a somewhat-random sampling of a species distribution, and hence the area actually occupied by a species will be larger than that given by accurately-located vouchers.
Voucher locations themselves are often vague, and georeferencing introduces additional errors. Both of these effects usually artifically increase the reported area for a species.
If the species I searched for included a subspecies, there might be many vouchers of the species itself, not determined to a subspecies, which would increase the area if they had been included.
Note that the area for some species may seem exceptionally small, if their distribution just barely reaches into the San Gabriel Mountains. For example, the area for Yucca brevifolia is given as just 5 square miles, even though it occupies a much-larger area in the adjacent Movaje Desert.
Also note that the number of vouchers may be significantly more than the number of voucher locations given in the maps in Fig. 2, due to duplicate vouchers and different collectors collecting from the same location.
See also Some Things You May Not Have Known About Vouchers.
Click on the maps to get larger versions
| North Edge Species | Northeast Side Species | Higher Elevation Species Surrounding SnGb River Basin | Other |
|---|---|---|---|

Yucca brevifolia 15 vouchers. 90 square miles | 
Pleiacanthus spinosus 27 vouchers. 35 square miles | 
Sarcodes sanguinea 54 vouchers. 95 square miles | 
Mentzelia congesta 34 vouchers. 40 min, 130 max square miles |

Opuntia basilaris var. brachyclada 42 vouchers. 170 square miles. | 
Tetradymia canescens 88 vouchers. 55 square miles | 
Ribes nevadense 148 vouchers. 45 min, 150 max square miles | 
Saltugilia splendens ssp. splendens 38 vouchers. 65 min, 140 max square miles |

Lomatium nevadense var. parishii 26 vouchers. 160 square miles | 
Caulanthus major 38 vouchers. 65 square miles | 
Pinus jeffreyi 93 vouchers. 120 square miles | 
Lupinus excubitus var. austromontanus 72 vouchers. 80 min, 270 max square miles |

Gutierrezia microcephala 39 vouchers. 195 square miles | 
Stipa parishii var. parishii 63 vouchers. 20 min, 70 max square miles | 
Arctostaphylos patula 181 vouchers. 70 min, 115 max square miles | 
Acmispon argophyllus var. argophyllus 29 vouchers. 25 min, 160 max square miles |

Eriogonum cithariforme var. agninum 26 vouchers. 15 min, 90 max square miles | (Intentionally left blank) | 
Gilia ochroleuca ssp. vivida 64 vouchers. 20 min, 70 max square miles | 
Stipa coronata 68 vouchers. 160 min, 770 max square miles |

Malacothamnus fremontii 88 vouchers. 65 min, 80 max square miles | (Intentionally left blank) | 
Linanthus concinnus 85 vouchers. 100 min, 160 max square miles | 
Eriodictyon trichocalyx var. trichocalyx 120 vouchers. 480 min, 605 max square miles |
Stephanomeria exigua ssp. coronaria 21 vouchers. 100 square miles | (Intentionally left blank) | 
Packera ionophylla 92 vouchers. 70 min, 220 max square miles | (Intentionally left blank) |

Pinus monophylla 87 vouchers. 80 min, 170 max square miles | (Intentionally left blank) | 
Leptosiphon breviculus 165 vouchers. 185 min, 320 max square miles | (Intentionally left blank) |
| (Intentionally left blank) | (Intentionally left blank) | 
Galium johnstonii 115 vouchers. 85 min, 335 max square miles | (Intentionally left blank) |
| (Intentionally left blank) | (Intentionally left blank) | 
Tauschia parishii 88 vouchers. 270 min, 425 max square miles | (Intentionally left blank) |
Fig. 2. Map of georeferenced voucher locations for species seen at Table Mountain.
Data provided by the participants of the Consortium of California Herbaria (ucjeps.berkeley.edu/consortium/), retrieved on 16 September 2015.