Dominant Species of the West Rim of Tahquitz Valley and Their Recent Death Rates, San Jacinto Mountains
Introduction
Survey Method
Dominant Species
Death Rates
Introduction
For an introduction to this dominant plant survey, see Dominant Species of the Devils Slide Trail and Their Recent Death Rates.
The survey results presented here were conducted on the Pacific Crest Trail (PCT) south of Saddle Junction, and the uppermost portion of the South Ridge Trail, on 10 September 2008, and on the PCT north of Saddle Junction on 23 September 2008.
Survey Method
The sampling from the first survey on 10 September 2008 was somewhat arbitrary; see Dominant Species of the Devils Slide Trail and Their Recent Death Rates.
The sampling on 23 September 2008 was done every 0.15 miles along the trail as recorded by a portable GPS unit, except that three ridge tops were sampled when encountered in order to sample that different environment. The next sample after the ridgetop was 0.15 miles from the ridge top.
The 21 surveyed locations are shown on the next map:

At each location, we visually surveyed all the relatively-nearby plant specimens out to a distance where we could be confident of making a reliable species determination for all of the dominant species in a given location. We in general did not go out to the maximum distance we could have surveyed so that identifications were quick and easy.
The surveyed distance was not the same at all locations, nor was it the same for all azimuth angles if my sightline was blocked in a given direction by nearby species. This probably creates a small bias toward taller species, since taller species can be seen behind shorter species, but not vice-versa. However, since most of the dominant species are similar-sized trees, this is probably a small effect.
Note that we counted plants, and not the area each plant covered. Since some of the survey locations were dominated by shrubs, to obtain area coverage the numbers of shrubs should be multiplied by the ratio of a typical shrub coverage area to a typical tree coverage area before combining the numbers.
Dominant Species
From all 21 locations, the dominant species are given in the following table in descending order of dominance by number, including both live and dead specimens for each species:
| % | # | Species | |||||||||||||||||||||||||||||||||||||||||||||
|---|---|---|---|---|---|---|---|---|---|---|---|---|---|---|---|---|---|---|---|---|---|---|---|---|---|---|---|---|---|---|---|---|---|---|---|---|---|---|---|---|---|---|---|---|---|---|---|
| 26% | 471 | Abies concolor
| 24% | 432 | Chrysolepis sempervirens
| 18% | 328 | Ceanothus cordulatus
| 9% | 158 | Arctostaphylos patula
| 9% | 156 | Pinus jeffreyi
| 4% | 80 | Pinus contorta ssp. murrayana
| 3% | 58 | Keckiella rothrockii var. jacintensis
| 2% | 42 | Prunus emarginata
| 2% | 39 | Pinus flexilis
| 2% | 37 | Pinus lambertiana
| 0% | 9 | Symphoricarpos rotundifolius var. parishii
| 0% | 5 | Quercus chrysolepis
| 0% | 2 | Calocedrus decurrens
| 0% | 2 | Holodiscus microphyllus
| | |
| 100% | 1819 | All
| |
Many of the species in this survey grow only in specific slope aspects. For example, limber and lodgepole pines, Pinus flexilis and P. contorta, are found preferentially on north-facing slopes, and Ceanothus cordulatus and Arctostaphylos patula are found preferentially on south-facing slopes. Because the dominant species vary significantly with slope aspect and elevation, there is no specific area that has the species in the same dominance ratio as given in the table above.
The survey route is approximately a north-south transect that has a minimum elevation at Saddle Junction in the middle. Since higher elevations are found both to the north and to the south, with very different slope aspects, the X-axis in the plots below is distance from the southernmost point. Since locations to the north often have south-facing slopes, and locations to the south often have north-facing slopes, this choice of X-axis separates those very different habitats.
The following plot shows the elevations corresponding to each distance value:

The slope and slope aspect was recorded for all locations in the 23 September 2008 survey, and for some locations in the 10 September 2008 survey. The recorded values are shown in the next plot:

Examples of some slope aspect values: 0° corresponds to a north-facing slope; 90° is an east-facing slope; and 180° is a south-facing slope. Flat slopes have no slope aspect, so appear to be missing in the above plot; they are shown in the next plot.
The following plot shows the slope values for all locations where they were measured:

The following plot shows the dominance at each location versus elevation for the top 5 dominant trees:

The relative number sums to unity for all species at a given location. As an example, at mile 0.00, the leftmost set of points in the above plot, only two species occurred at that survey location:
| Relative Number | Species |
|---|---|
| 0.80 | Pinus flexilis |
| 0.20 | Chrysolepis sempervirens |
| 1.00 | All species |
The plot above only shows the Pinus flexilis, so the numbers don't necessary total to unity from just the species shown in the above plot.
Interestingly, in this survey, limber pine, Pinus flexilis, was mostly found in the southernmost part of the survey, on the open north slopes of Tahquitz Peak and on the open slopes of the ridge extending north from Tahquitz Peak. In contrast, in this survey, lodgepole pine, Pinus contorta was found only on the more heavily-forested north slopes of the Marion Ridge, despite that area having similar slopes, similar slope orientation, and similar elevations.
In fact, both species are present in both areas, although the relative numbers of each species are in agreement with the survey results. On the entire South Ridge Trail on the north side of Tahquitz Peak, we previously found about half as many lodgepole pines as limber pines; it just happened that the single survey location on that trail missed any of the lodgepole pine specimens. On the surveyed portion of the PCT near the Marion Ridge, we noticed infrequent specimens of limber pine, and the survey locations did pick up that small rate of occurrence.
Abies concolor shows a strong preference for being in the southern part of this survey, but also grows in the northern part as well. Pinus jeffreyi shows a strong preference for being in the middle part of the survey, and is virtually absent on the north-facing slopes.
Pinus lambertiana is essentially only found in a few locations in the southern part of the survey.
The following plot shows the dominant shrubs in this survey:

The shrubs are essentially absent in the Abies concolor forest in the middle of the southern segment of this survey. Chrysolepis sempervirens is a strong component nearly everywhere else, with Ceanothus cordulatus and Arctostaphylos patula a strong component on south-facing slopes.
Death Rates
The death rate calculated here should be interpreted with caution, since it depends on observing dead specimens that are still present in good enough shape to be identified. No fallen trees were included in the survey; only still-standing dead trees and recognizable dead shrubs. If there is a difference between species in how long recognizable dead species persist, the rates calculated here would not be directly comparable between species.
The following table gives the number of live and dead plants for each species, in declining order by death rate, along with the one standard deviation uncertainty in the death rate calculated from the data:
| % dead | # alive | # dead | Species |
|---|---|---|---|
| 0.26 ± 0.02 | 242 | 86 | Ceanothus cordulatus |
| 0.22 ± 0.02 | 336 | 96 | Chrysolepis sempervirens |
| 0.15 ± 0.02 | 398 | 73 | Abies concolor |
| 0.08 ± 0.02 | 145 | 13 | Arctostaphylos patula |
| 0.04 ± 0.02 | 77 | 3 | Pinus contorta ssp. murrayana |
| 0.03 ± 0.01 | 152 | 4 | Pinus jeffreyi |
| 0.00 ± 0.00 | 58 | 0 | Keckiella rothrockii var. jacintensis |
| 0.00 ± 0.00 | 42 | 0 | Prunus emarginata |
| 0.00 ± 0.00 | 39 | 0 | Pinus flexilis |
| 0.00 ± 0.00 | 37 | 0 | Pinus lambertiana |
| 0.00 ± 0.00 | 9 | 0 | Symphoricarpos rotundifolius var. parishii |
| 0.00 ± 0.00 | 5 | 0 | Quercus chrysolepis |
| 0.00 ± 0.00 | 2 | 0 | Calocedrus decurrens |
| 0.00 ± 0.00 | 2 | 0 | Holodiscus microphyllus |
| 0.15 ± 0.01 | 1544 | 275 | All |
The top four species account for 97% of all the dead individuals.
The death rate by species at each location is shown in the next plot:

Note the extensive area of shrub death at miles 2.0 to 2.8, which coincides with a transition between high death rates for Abies concolor at lower elevations and low death rates at higher elevations.
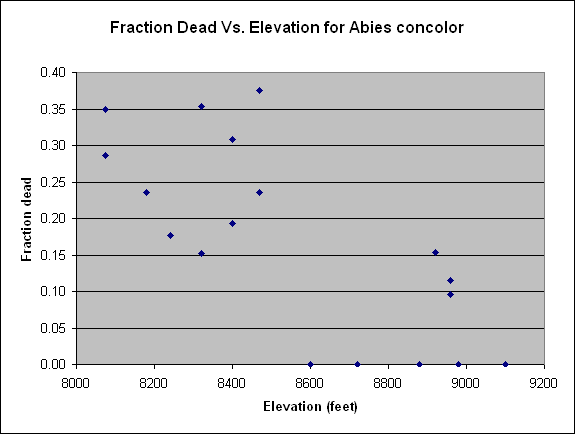
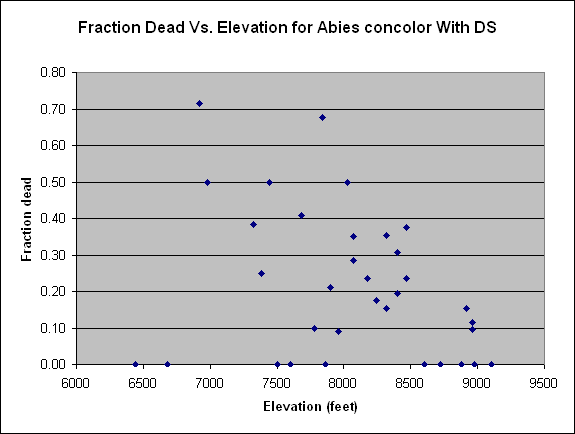
As also found on the Devils Slide Trail, the percent of dead Abies concolor is highest at its lower elevations. The following plot shows just the results of this survey, followed by a plot that includes the results from the Devils Slide Survey.


In fact, we noticed in the survey that the specimens of Abies concolor at higher elevation looked much more robust, with denser branches and many more needles, than specimens at lower elevation.
This trend was suggested by the results from the Devils Slide survey, but was not significant using just those data. With the data from this survey, this trend is now highly significant. The following plot bins the data by elevation, and gives the one sigma error bars for the death rates. The elevation error bars gives the full range of all elevations included in each bin. The centers of the elevation bins correspond to the average values of all elevations in the bin. Those average values are at the center of each bin except for the highest elevation bin.

The significance of the drop in death rate is very high. For example, the difference between the rate from 8000 to 8500 feet and the rate from 8500 to 9100 feet is 0.192 ± 0.031, a difference of 6.2 sigma. The probability that this is due to chance is less than one in one billion (10-9).