Plants of Southern California: Heuchera elegans (H. caespitosa)
Summary
Introduction
Measurements
Analysis
Summary
This page reports an analysis of five plants, one from each of five well-separated populations in an area on the north slope of the San Gabriel Mountains where both H. elegans and H. abramsii have been vouchered. The plants here vary in hairiness between those having the long hairs of H. elegans and those lacking such hairs as does H. abramsii. I analyzed those plants specifically to see if two different species were actually present, or whether these plants all represented a single species. For each plant, I measured 39 different characteristics of the plant, stem, leaves, and inflorescence.
A Principal Components Analysis of those measurements shows that these five plants appear to be the same species, with no significance to the variation in the amount of long hairs in these populations.
Introduction
See Plants of Southern California: Heuchera species for an overview of all the Heuchera species in southern California, with pictures and the range for each species.
The Jepson Manual Second Edition has synonymized H. elegans with H. caespitosa.
This study was motivated by finding plants in the Lily Spring Survey Area that appeared to fit the Jepson Manual key for H. abramsii, amidst plants that appeared to fit the key for H. elegans, as well as finding vouchers of both species from this area. I wanted to measure enough characteristics on enough plants to find out whether two species were actually present here.
The locations where Heuchera plants were sampled are shown in Fig. 1, in the area from Islip Saddle and Mt. Islip to Vincent Gap and Mt. Baden-Powell, along the Angeles Crest Highway (SR2) and the Pacific Crest Trail (PCT):
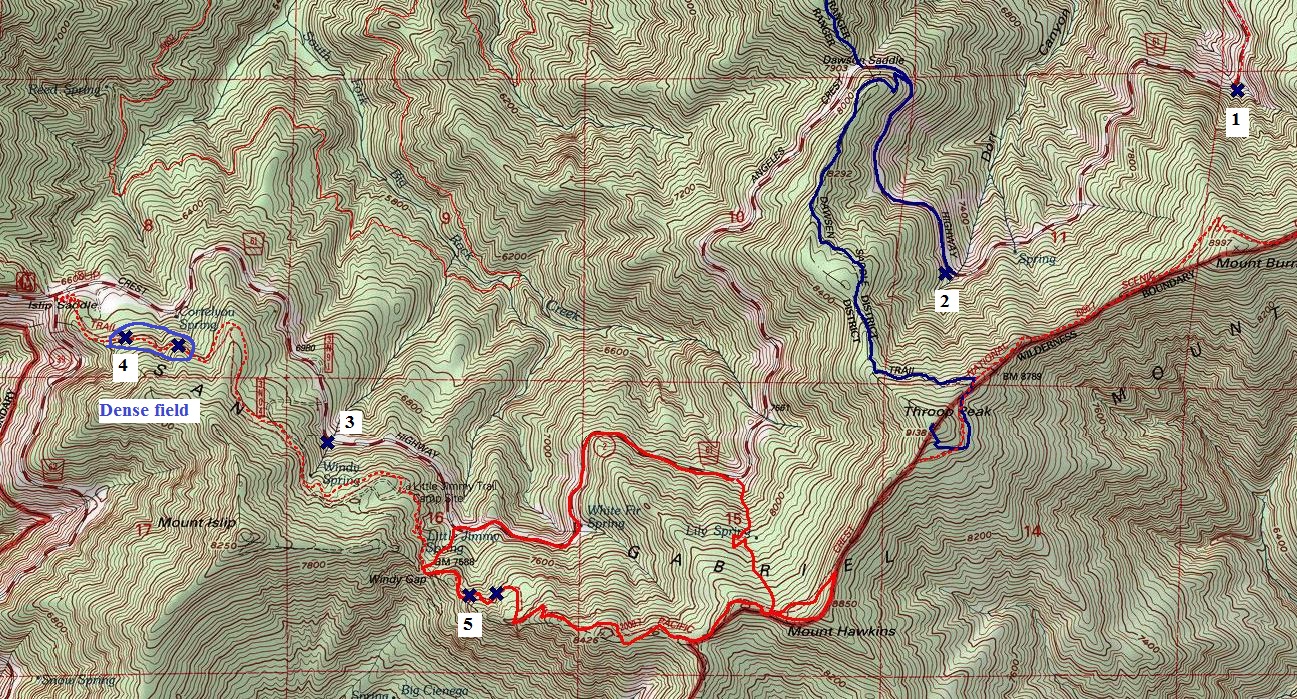
Fig. 1. The locations of the five sampled Heuchera plants are shown by the numbered blue crosses. The distance from location #1 to location #4 is 3.8 miles. Click on the picture for a larger version.
The Heucheras along the Angeles Crest Highway (SR2) in this section were found only in the drainages except near Islip Saddle. Along the PCT from Islip Saddle to Windy Gap, they were found only in the dense field indicated by the blue outlined area in Fig. 1. Another population of Heucheras was encountered beginning at the point labeled "5" east of Windy Gap, but its extent eastward was not mapped.
Table 1 gives the geographic coordinates for each of the plants analyzed (WGS84 datum), and the distance of each plant from plant #4.
Table 1. Heuchera Specimens Analyzed
| Plant # | Lat | Lon | Elevation (feet) | Distance from Plant #4 (mile) |
|---|---|---|---|---|
| 1 | 34.36688 | -117.78126 | 7280 | 3.8 |
| 2 | 34.35794 | -117.79850 | 7720 | 2.8 |
| 3 | 34.34969 | -117.83492 | 7070 | 0.8 |
| 4 | 34.35481 | -117.84671 | 7000 | 0.0 |
| 5 | 34.34218 | -117.82653 | 7750 | 1.5 |
There is a single voucher determined as H. abramsii in this area, at the location of plant #2, from one mile east of Dawson Summit. There are vouchers of H. elegans from four different locations in this area: Cortelyou Springs; North slope of Mount Islip from Little Jimmy Campground to the summit; Near summit of Mt. Islip; and Mt. Islip Ridge.
Measurements
Table 2. Measurements on Heuchera Specimen
| Characteristic | 1 | 2 | 3 | 4 | 5 |
|---|---|---|---|---|---|
| petiole length min (mm) | 10 | 15 | 10 | 18 | 10 |
| petiole length max (mm) | 25 | 20 | 23 | 20 | 15 |
| leaf length min (mm) | 12 | 13 | 14 | 14 | 10 |
| leaf length max (mm) | 15 | 21 | 22 | 18 | 15 |
| leaf width min (mm) | 11 | 15 | 10 | 15 | 12 |
| leaf width max (mm) | 20 | 21 | 20 | 25 | 18 |
| terminal lobe length min (mm) | 5 | 8 | 7 | 5 | 5 |
| terminal lobe length max (mm) | 10 | 10 | 10 | 9 | 9 |
| stem length min (cm) | 10 | 10 | 8 | 10 | 11 |
| stem length max (cm) | 18 | 20.5 | 16 | 17 | 16 |
| # infl branches min | 6 | 7 | 7 | 10 | 9 |
| # infl branches max | 13 | 13 | 15 | 12 | 14 |
| infl length min (cm) | 6 | 5 | 6 | 6 | 4 |
| infl length max (cm) | 11 | 12 | 12 | 9 | 9 |
| infl width min (cm) | 1.5 | 1.8 | 2 | 2.2 | 2 |
| infl width max (cm) | 3 | 4.2 | 3 | 3.5 | 3.5 |
| st # long hairs per cm | 25 | 20 | 0 | 9 | 2 |
| infl # long hairs above first node | 7 | 3 | 0 | 25 | 0 |
| pedicel # long hairs | 0 | 0 | 0 | 0 | 0 |
| hyp # long hairs min | 0 | 10 | 1 | 15 | 0 |
| hyp # long hairs max | 2 | 30 | 20 | 20 | 15 |
| calyx lobes # long hairs min | 0 | 0 | 0 | 0 | 0 |
| calyx lobes # long hairs max | 5 | 10 | 15 | 16 | 10 |
| pedicel length min (mm) | 1.5 | 1.5 | 2 | 1.5 | 1 |
| pedicel length max (mm) | 4 | 3.5 | 3 | 3 | 4 |
| Hyp+calyx length min (mm) | 5 | 6 | 7 | 6 | 5 |
| Hyp+calyx length max (mm) | 6.5 | 8.5 | 7.5 | 7.5 | 6 |
| Hyp width min (mm) | 2 | 2 | 2.1 | 2 | 2 |
| Hyp width max (mm) | 2.8 | 2.5 | 2.8 | 2.2 | 2.2 |
| length hyp fused to ovary min (mm) | 2 | 2 | 2.5 | 2 | 2 |
| length hyp fused to ovary max (mm) | 2.4 | 2.5 | 3 | 2.5 | 2 |
| calyx lobes min (mm) | 2 | 1.5 | 1.1 | 1.2 | 1 |
| calyx lobes max (mm) | 3 | 3 | 2.5 | 2.8 | 3 |
| calyx lobe tip difference min (mm) | 0.9 | 0.8 | 0.5 | 0.5 | 0.2 |
| calyx lobe tip difference max (mm) | 0.9 | 1 | 0.8 | 0.6 | 0.6 |
| petal exserted length past tip of calyx lobes min (mm) | 1 | 1.5 | 1.5 | 1 | 1.3 |
| petal exserted length past tip of calyx lobes max (mm) | 2 | 2 | 2.5 | 2.2 | 2 |
| petal length (mm) | 3.5 | 4.5 | 5 | 5.5 | 4.5 |
| claw length (mm) | 2 | 2.9 | 2.9 | 3 | 2.5 |
| petal width (mm) | 0.7 | 1 | 1.2 | 1.1 | 1.2 |
| stamen exserted length past tip of calyx lobes min (mm) | -0.2 | -1.8 | -1 | 0 | 0 |
| stamen exserted length past tip of calyx lobes max (mm) | 0 | -0.9 | -1 | 0 | 0.2 |
Details on some of the measurements:
terminal lobe length: This was measured from the tip of the terminal lobe to the base of the first major division with the next lobe.
long hairs: Any hair with a stalk significantly exceeding the stalks of the abundant short-stalked glands was considered a long hair.
length hyp fused to ovary: This was measured from the outside of the hyptanthium, and was usually easy to distinguish because this was the widest point of the hypanthium, and the color of the hypanthium changed at that point.
calyx lobes: This was measured from the tip of each lobe to the base of the division with the neighoring lobes.
calyx lobe tip difference: This was the length between the longest calyx lobe tip and the shortest calyx lobe tip, ignoring any difference in depth to the base of the lobes.
petal exserted length past tip of calyx lobes: This was measured from the longest calyx lobe tip.
stamen exserted length past tip of calyx lobes: This was measured for the longest stamen relative to its calyx lobe tip. A positive value means it extended past the tip of the lobe.
Analysis
A Principal Components Analysis of the above data is shown in Fig. 2:
Fig. 2. A Principal Components Analysis of 39 measured characteristics for the five plants, with each plant labeled. The red lines represent the components for each of the 39 variables for PC1 and PC2.
The plot shows that all five plants scatter about the mean of the plot, with no significant weighting in any direction of the 39 variables. This is consistent with all five plants being the same species.
PC1 accounts for 13.9 of the variance, 3.7 of the standard deviation of the data; PCT for 11.5 of the variance, 3.4 of the standard deviation. Thus the spread in the data for the PC1 values is 1.6 standard deviation units, only 4% of the 39 total standard deviations of the data set.