Bloom Reports from the Anza-Borrego Desert: Number of Species and Plants in Bloom On Each Trip 2014-2015
Number of Species and Plants in Bloom On Each Trip
This page gives numerical summary information about the 2014-2015 bloom for all species in this area. The date of the last update to the text of this page is given at the bottom of this page. However, the plots below showing the progress of the bloom are always kept up to date, even if this page hasn't been recently updated otherwise.
For detailed information about the 2014-2015 bloom, see List of Species in Bloom On Each Trip, With Photographs 2014-2015 and 2014-2015 Detailed Observations from each trip.
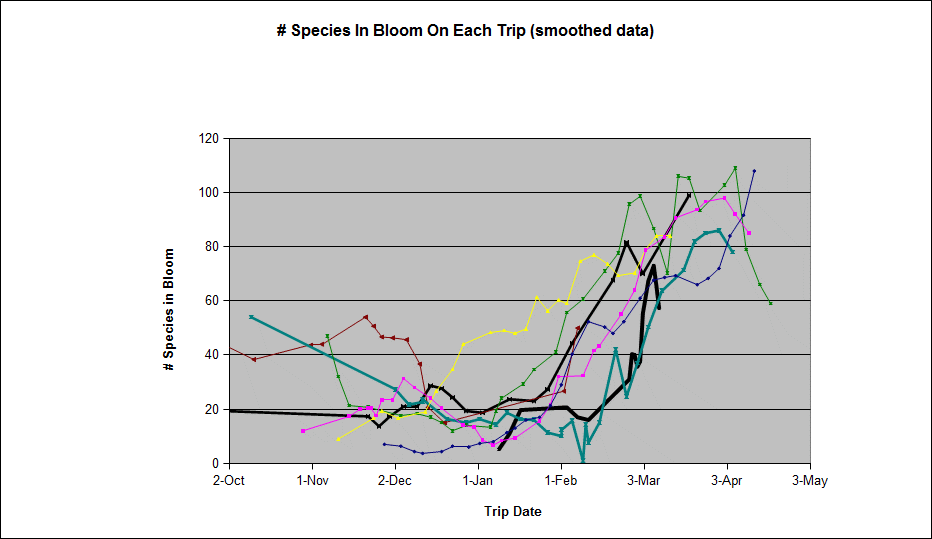
The plots below also show the progress of the bloom in 2008-2009 (blue), 2009-2010 (hot pink), 2010-2011 (yellow), 2011-2012 (green), 2012-2013 (turquoise), 2013-2014 (red). For detailed progress of the bloom in those years, see 2011-2012 Blooms and the links therein.
Five plots are given below; each plot has this year's bloom data as well as last year's bloom data for comparison:
- The first two plots, Figures 1-2, show what was observed on each trip, the total number of species in bloom and the total number of plants in bloom. The total number of plants in bloom for each individual species is capped at a maximum of 99 plants.
In order to see the variation from year to year better, the curves are smoothed by averaging each point (except for the first and last point for each year, and any points that are very discrepant from their neighbors due to a change in surveyed location) with its neighbors in time, in order to reduce the large scatter from trip to trip that comes from changing venues. The actual (unsmoothed) data for each trip is given in Table 4.
- The next two plots, Figures 3-4, give the cumulative total numbers from all trips so far this season, of all species seen in bloom and of all annual species that germinated this year and have begun blooming. Thus this does not count any annual species that survived from last year and is now blooming. These cumulative total numbers include the number of species on a given trip as well as those from all trips previous to that trip.
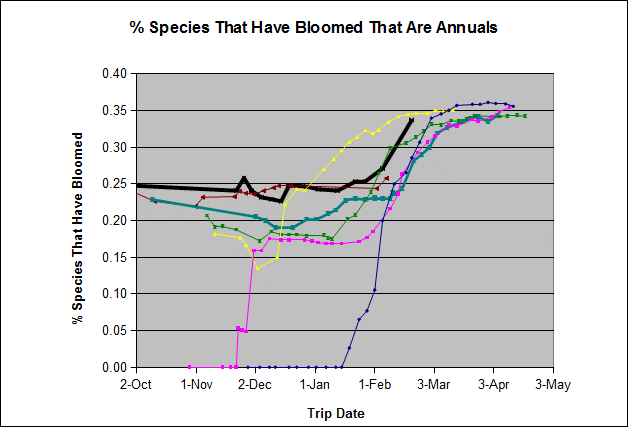
The last plot, Figure 5, gives the percent of the species that have bloomed so far that are annuals.
The plots and the table here must be interpreted cautiously, for at least four reasons:
- Long hikes will find more plants in bloom than short hikes. For example, the hikes of 12/29/08, 1/2/09 and 1/9/09 were all in Henderson Canyon, but were 4, 7 and 8 miles long, respectively. The increase in the number of plants was due almost entirely to the length covered.
- Some areas have a higher species diversity than others, and so will have more species blooming at a given time. For example, on 2/20/09, Tom botanized the Borrego Badlands, which had significantly fewer species than the Coyote Creek area he had botanized for the previous two trips. As a result, the total number of species observed in bloom skidded from 61 to 35, even though the bloom overall in the Borrego Desert was still getting better. Note that the cumulative number of species, and annuals, seen to be in bloom from all trips that year continued to increase, since the Badlands had some species not found elsewhere.
- There is variation from year to year in the choice of hiking locations, often influenced by weather variations. For example:
In 2009-2010, Tom began by botanizing the Coyote Creek Area, which had abundant water along the Creek. As a result, Tom found significantly more species in bloom than he did in 2008-2009, when he began by botanizing the very dry Clark Lake Area.
On 12/1/09, Tom visited an area that had received a summer thunderstorm on 5 September 2009, and as a result had many more species in bloom than anyplace else he visited in December 2008 or December 2009.
The curves for November and December for 2008-2009 and 2009-2010 could thus easily have been switched between years if Tom had also switched areas botanized in each year. (I.e., if Tom had botanized wet / monsoon storm areas in 2008-2009 and dry areas in 2009-2010.)
- Although the numbers of species and plants in bloom might be the same in different years, the bloom might actually be quite different overall in those years. For example, although the curves for 2011-2012 hit roughly the same values as the curve for 2010-2011 in mid-February, wide areas of the desert had essentially no blooms at all in 2011-2012. The curves look similar simply because we chose to botanize in the areas where there were blooms.
In particular, we happened to visit one of those areas with few blooms in 2011-2012, on 7 March 2012, which accounts for the big dip in the green curve to 472 plants of 33 species in bloom, very different from the surrounding numbers of ~3000 plants of ~100 species in bloom. We did not average that observation with the neighboring points in time.
That said, in general the curves mostly all look roughly the same, with low numbers of plants and species in bloom in the fall and early winter, with the numbers increasing when the annuals begin blooming in January, February or March. When full bloom begins depends on when the first germinating rainfall occurs, and the subsequent heat and rainfall conditions. If there has been adequate rain, the perennials will begin blooming at about the same time.
The curves can sometimes follow each other closely. For example, the number of species in bloom on a trip to Clark Valley on 12/19/09 produced almost exactly the same number of species in bloom as the 12/19/08 trip a year earlier.
Very different curves result from those infrequent years with heavy monsoonal rains in September, which can produce a large number of species in bloom as early as October, such as occurred in 2013-2014.
In the following plots, the years are color-coded as follows: 2008-2009 (blue), 2009-2010 (hot pink), 2010-2011 (yellow), 2011-2012 (green), 2012-2013 (turquoise), and 2013-2014 (red). The 2014-2015 year is shown in heavy black.
Figure 1. Number of Species in Bloom on Each Trip
|
Figure 2. Number of Plants in Bloom on Each Trip
|
Figure 3. Cumulative Number of Species Seen in Bloom From All Trips
|
Figure 4. Cumulative Number of Annual Species Seen in Bloom From All Trips
|
Figure 5. Percent of All Species Seen in Bloom From All Trips That Are Annuals
|
In the above plots, the years are color-coded as follows: 2008-2009 (blue), 2009-2010 (hot pink), 2010-2011 (yellow), 2011-2012 (green), and 2012-2013 (turquoise). The 2013-2014 year is shown in heavy black.
Table 4 gives the numbers used for the above plots. The individual observations used to obtain these numbers are in the List of Species in Bloom On Each Trip.
Table 4. Number of Species and Total Number of Plants in Bloom on Each Trip
| Number of | Date (Month / year on first line below; day on second line below) | ||||||||||||||||||||||||
|---|---|---|---|---|---|---|---|---|---|---|---|---|---|---|---|---|---|---|---|---|---|---|---|---|---|
| 8/2014 | 9/2014 | 11/2014 | 12/2014 | 1/2015 | 2/2015 | ||||||||||||||||||||
| 12 | 2 | 22 | 26 | 30 | 5 | 10 | 15 | 19 | 23 | 28 | 3 | 13 | 22 | 27 | 5 | 20 | |||||||||
| Species | 18 | 38 | 4 | 10 | 27 | 15 | 21 | 27 | 38 | 18 | 17 | 23 | 16 | 28 | 21 | 29 | 79 | ||||||||
| Plants | 302 | 1275 | 32 | 36 | 167 | 84 | 275 | 321 | 338 | 150 | 195 | 263 | 165 | 155 | 334 | 334 | 3206 | ||||||||